Just for fun I tested whether it is possible to draw a fractal with Matlab. (Yes, it is, no big surprise 😉 )
The Mandelbrot set is calculated with following equation:
\( z_n = z_{n-1}^2 + p \)with the initial condition \( z_0 = 0 \). The point \( p \) is any arbitrary point in the complex plane. The Mandelbrot set is the set of all points \( p \), for which the magnitude
\( \left| \lim\limits_{n\rightarrow\infty} z_n \right| < \infty \)which simply means that the magnitude is bounded.
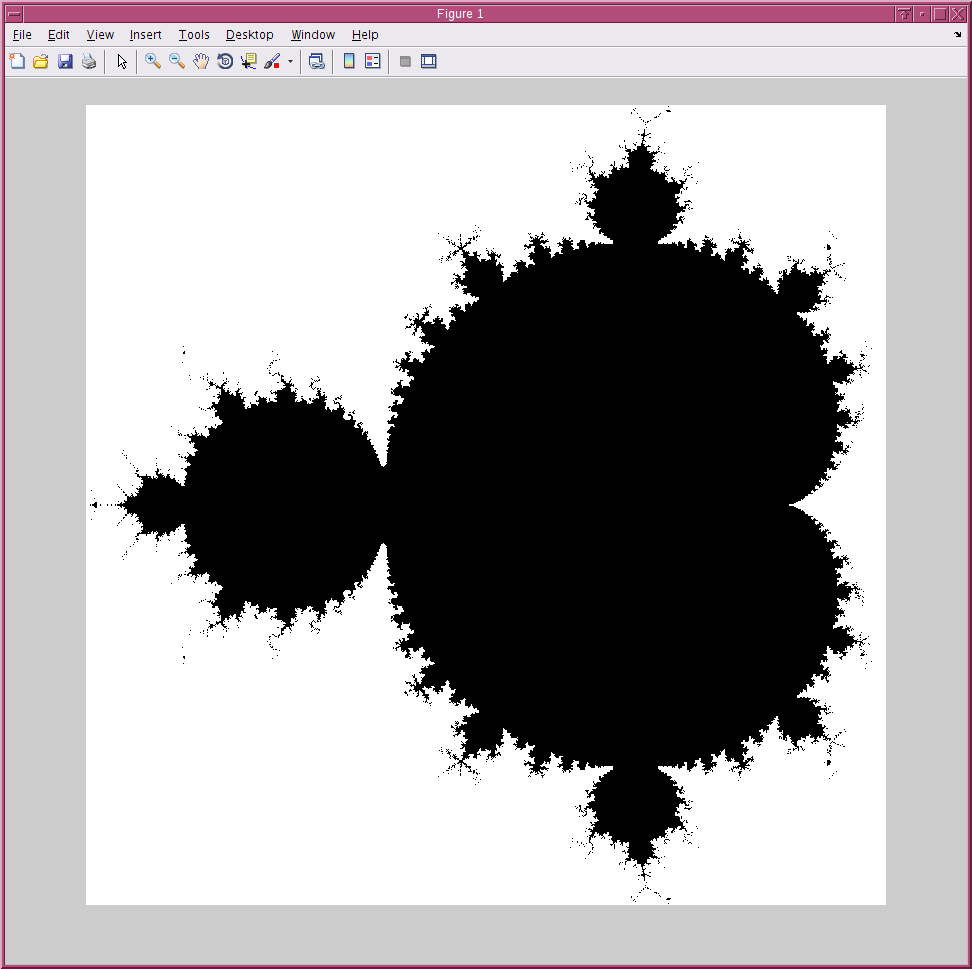
To calculate a Mandelbrot set, just select any point \( p \) and then check whether \( \left| z_n \right| \) remains bounded for increasing \( n \). To do so, simply try different \( n \) values in a loop. If the magnitude remains bounded, paint the corresponding point black, otherwise paint it white. Do this for all points on the complex plane, and you have the Mandelbrot set 🙂 using Matlab, one can do that and will have following result:
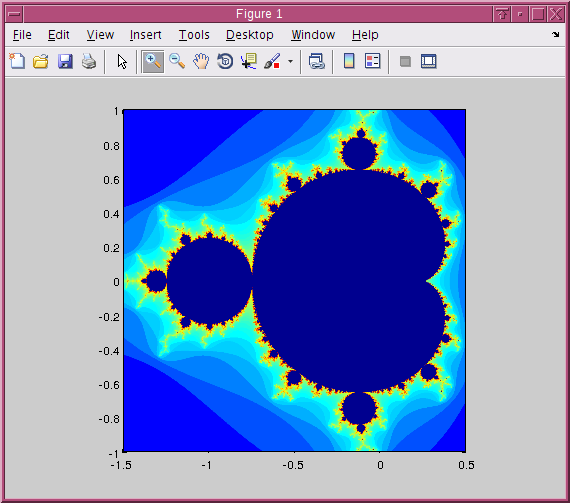
OK we kind of expected this result. But just black and white is a bit boring. Further it is sort of unsatisfactory to check the magnitude of \( z_n \) for a lot of values for \( n \); this seems like a steamroller tactics 😉 But with the aid of the triangle inequality one can show that the series diverges as soon as one of its elements has a magnitude of greater than 2. So, to calculate the Mandelbrot set, we can calculate \( \left| z_n \right| \) for a (much lower) number of \( n \)s and check whether it becomes greater than 2. If this does not happen, the point belongs to the Mandelbrot set and we paint it black; if it does not belong to the Mandelbrot set, we paint this point with a color depending on how many iteration steps we needed to find out that \( z_n \) diverges. Following Matlab/Octave code does this for us:
resx = 1000;
resy = 1000;

xmin = -1.5;
xmax = 0.5;
ymin = -1;
ymax = 1;

x = linspace(xmin, xmax, resx);
y = linspace(ymin, ymax, resy);
mandel = zeros(resx, resy);

for xx = 1:resx
    for yy = 1:resy
        p = x(xx) + 1i*y(yy);
        z = 0;

        for k = 1:100
            if abs(z) > 2
                mandel(yy, xx) = k;
                break;
            end
            z = z^2 + p;
        end
    end
end

figure(1);
pcolor(x, y, mandel);
shading interp
axis([xmin xmax ymin ymax])
axis square
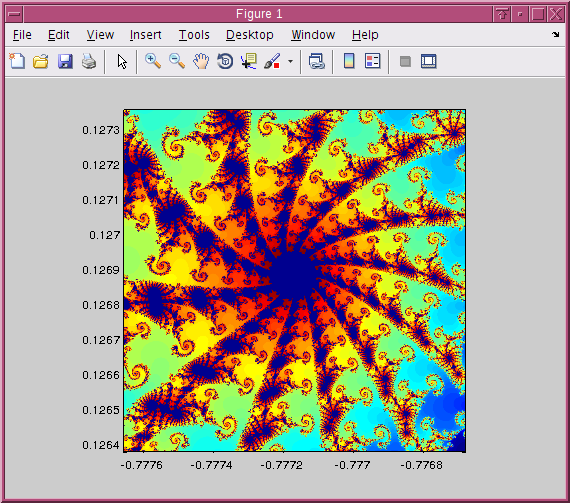
Usint that code, I generated the following pics.